
Neighborhood Health Profile Reports
The Neighborhood Health Profiles bring together data about significant health outcomes and present them for each of the 55 Community Statistical Areas in the city of Baltimore. Community Statistical Areas are clusters of neighborhoods developed by the City’s Planning Department based on recognizable city neighborhoods. Each NHP compares the CSA’s health outcomes to the city as a whole. Analysis of these data reinforces that where we live, learn, work, and play has a powerful impact on our health.
Please select a neighborhood from the list below to view that neighborhood's health profile. Please click here to learn more about these reports and to see citywide data.
This page contains links to files that may require additional software to view. You may download a free viewer here.
NOTE: These 55 reports were revised on June 9, 2017. Please ensure you are using the most recent version.
2017 Neighborhood Health Profile Data Downloads
Click here to download an Excel file of the 2017 Neighborhood Health Profile data (revised June 9, 2017).
Click here to download a PDF of technical notes for the 2017 Neighborhood Health Profile data (revised June 9, 2017).
Community Statistical Area*
Allendale/Irvington/South Hilton 2017 Profile
Beechfield/Ten Hills/West Hills 2017 Profile
Belair-Edison 2017 Profile
Brooklyn/Curtis Bay/Hawkins Point 2017 Profile
Canton 2017 Profile
Cedonia/Frankford 2017 Profile
Cherry Hill 2017 Profile
Chinquapin Park/Belvedere 2017 Profile
Claremont/Armistead 2017 Profile
Clifton-Berea 2017 Profile
Cross-Country/Cheswolde 2017 Profile
Dickeyville/Franklintown 2017 Profile
Dorchester/Ashburton 2017 Profile
Downtown/Seton Hill 2017 Profile
Edmondson Village 2017 Profile
Fells Point 2017 Profile
Forest Park/Walbrook 2017 Profile
Glen-Fallstaff 2017 Profile
Greater Charles Village/Barclay 2017 Profile
Greater Govans 2017 Profile
Greater Mondawmin 2017 Profile
Greater Roland Park/Poplar Hill 2017 Profile
Greater Rosemont 2017 Profile
Greenmount East 2017 Profile
Hamilton 2017 Profile
Harbor East/Little Italy 2017 Profile
Harford/Echodale 2017 Profile
Highlandtown 2017 Profile
Howard Park/West Arlington 2017 Profile
Inner Harbor/Federal Hill 2017 Profile
Jonestown/Oldtown 2017 Profile
Lauraville 2017 Profile
Loch Raven 2017 Profile
Madison/East End 2017 Profile
Medfield/Hampden/Woodberry/Remington 2017 Profile
Midtown 2017 Profile
Midway/Coldstream 2017 Profile
Morrell Park/Violetville 2017 Profile
Mount Washington/Coldspring 2017 Profile
North Baltimore/Guilford/Homeland 2017 Profile
Northwood 2017 Profile
Oldtown/Middle East 2017 Profile
Orangeville/East Highlandtown 2017 Profile
Patterson Park North & East 2017 Profile
Penn North/Reservoir Hill 2017 Profile
Perkins/Middle East 2017 Profile
Pimlico/Arlington/Hilltop 2017 Profile
Poppleton/The Terraces/Hollins Market 2017 Profile
Sandtown-Winchester/Harlem Park 2017 Profile
South Baltimore 2017 Profile
Southeastern 2017 Profile
Southern Park Heights 2017 Profile
Southwest Baltimore 2017 Profile
The Waverlies 2017 Profile
Upton/Druid Heights 2017 Profile
Washington Village/Pigtown 2017 Profile
Westport/Mount Winans/Lakeland 2017 Profile
* Community Statistical Area (CSA) boundaries were redrawn after the 2010 decennial U. S. Census; most notably, the area originally comprised of the CSAs Jonestown/Oldtown and Perkins/Middle East is now comprised of the CSAs Harbor East/Little Italy and Oldtown/Middle East. This change occurred during the publication of the 2011 Neighborhood Health Profiles; hence those and the 2008 reports refer to the original CSA boundaries, while the 2017 reports refer to the redrawn CSA boundaries.
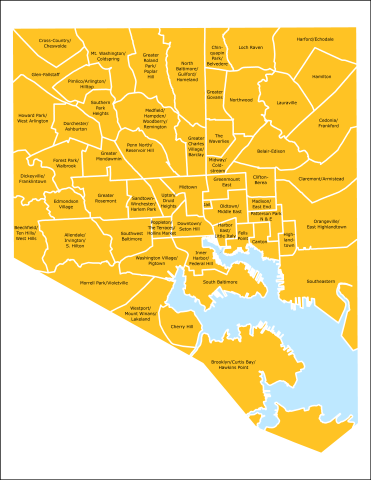
Community Statistical Area Boundaries for the 2017 Neighborhood Health Profiles
Community Statistical Area Boundaries for the 2008 and 2011 Neighborhood Health Profiles
